为什么你的 vLLM p99 延迟在生产环境暴涨,以及分块预填充和调度如何解决

Here is a thing that has happened to me more than once. I benchmark a model, the numbers look great, p50 latency is low, tokens per second is high. Then real traffic shows up and the p99 latency is suddenly 5 to 10 times worse than anything I measured. Same model and same GPU. So what happened? The benchmark was too clean.
Most load tests send requests at a steady pace, all about the same size. Real traffic does not do that. It comes in bursts, it mixes tiny prompts with huge ones, and it shares the GPU across a lot of users at once. Under that kind of load, one thing hurts your tail more than raw compute ever will: a long prefill blocking the decodes that are already running.
When a big prompt starts its prefill, the token generation for everyone else can get stuck waiting behind it. The GPU is stuck in a scheduling problem. So let’s walk through why this happens, why continuous batching does not fully fix it, and how chunked prefill and better scheduling get your tail back under control.
If you want the groundwork first, read the Continuous Batching Mechanics article that explains the scheduler that all of this sits on top of.
Continuous batching helped, but it did not finish the job!
If you serve LLMs at all, you have already moved beyond static request-level batching. With static (request-level) batching, the server groups a batch, runs it, and does not let anyone leave until the slowest request in the group is done. Fast requests just sit there waiting for slow ones. It wastes GPU time and it wrecks latency.
Continuous batching fixed a big chunk of that. Instead of locking in one group of requests for the whole run, the scheduler re-decides the batch before every step. Two things follow from that. A request that finishes leaves right away and frees its memory, instead of holding up everyone else until the batch drains. And a waiting request can be pulled in as soon as there is room, instead of sitting in a queue until the current batch is completely done. This step-by-step scheduling is the idea from the Orca paper (Yu et al., 2022) that vLLM and most modern servers use today.
It leaves one gap open, and that gap is where your tail lives. Prefill and decode are two very different kinds of work:
- Prefill reads the whole prompt in one forward pass. It is compute-bound. Big matrix multiplies, high GPU use. A long prompt means a long, heavy prefill. Prefill is usually the biggest piece of your time to first token (TTFT), but it is not the whole story. TTFT is really the sum of a few delays: time spent waiting in the queue, scheduler overhead in admitting the request, the prefill itself, and network round trips to and from the client.
- Decode generates one token at a time. It is memory-bandwidth-bound. It mostly shuffles weights and KV cache in and out of memory, and it needs frequent short turns to keep inter-token latency (ITL) low so the stream feels smooth.
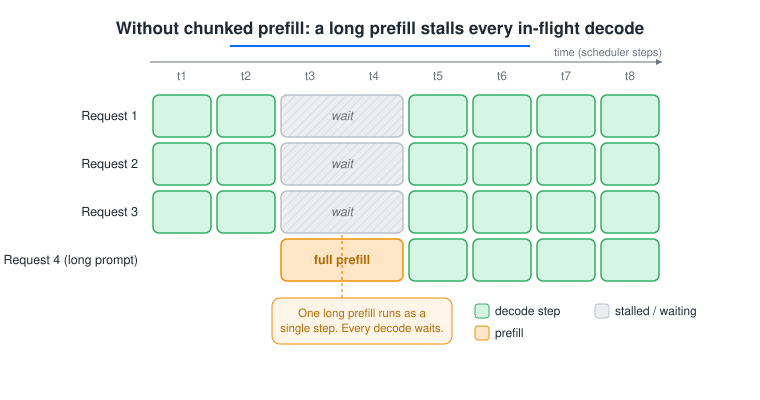
Continuous batching still tends to run a prefill as one big unit. So when a long prompt lands in the batch, that iteration takes a while, and every decode already in flight has to wait for it. Users who were happily streaming tokens suddenly hit a pause. That pause is your p99. Mixing prefill and decode badly is where tail latency comes from, and it is a scheduling problem.
This is not a small effect. The Sarathi-Serve team (Agrawal et al., OSDI 2024) measured that a single prefill sharing the batch can push inter-token latency up by as much as 28x versus a decode-only batch. That is why a benchmark can look fine on average and still fall apart at the tail.
PagedAttention, scoped correctly
PagedAttention is about KV cache memory. It is not a scheduler. The idea, from the vLLM paper (Kwon et al., 2023), is to treat the KV cache like virtual memory in an operating system. Instead of reserving one big block per sequence, it splits the cache into small fixed-size blocks that can sit anywhere in GPU memory. That cuts the space wasted on fragmentation, lets you keep more sequences in memory at once, and makes it cheap to share cache between sequences that share a prefix.
So where does latency come in? Only indirectly. Before PagedAttention, memory was usually the first limit you ran into on how many sequences you could hold in a batch, because each one had to over-reserve cache space for its worst-case length. Once memory stops being the thing that boxes you in, the scheduler has a lot more room to decide how to mix prefills and decodes. PagedAttention does not schedule anything. It just clears the runway so a good scheduler can do its job.
But clearing the memory constraint does not tell the scheduler how to fit a big prefill into the batch without stalling the decodes around it. That is the exact problem chunked prefill exists to solve.
Chunked prefill: how it works and where it costs you
Chunked prefill is the direct fix for the blocking problem. The idea is simple to say. Instead of running a long prefill all the way to the end in one iteration, you split it into smaller chunks of tokens. Then in each iteration you run one prefill chunk alongside the decodes that are already going. The decodes keep getting their turns, so the stream stays smooth, while the long prompt still makes steady progress in the background.
This is the “stall-free” scheduling idea from the Sarathi-Serve work (Agrawal et al.). In their tests, admitting prefills this way let a server handle up to 2.6x more traffic within the same latency target for Mistral-7B on a single A100, and up to 6.9x more for the much larger Falcon-180B spread across eight A100s, compared with Orca and vLLM.
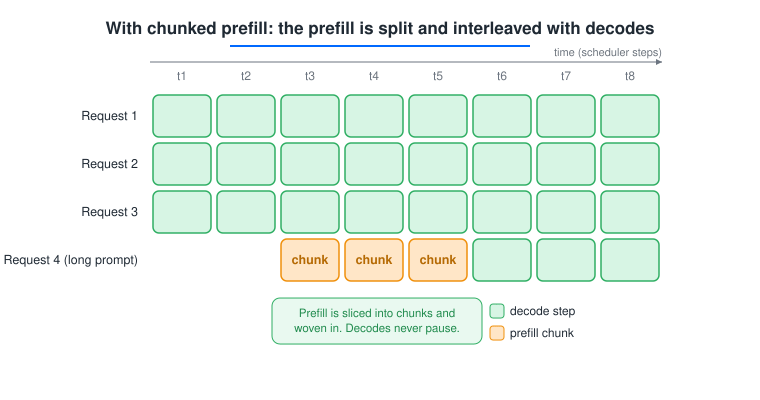
The catch is chunk size, and this is where a lot of content stays too shallow. There is a real tradeoff:
- Chunks too small: decodes stay snappy, but the long prompt now needs many iterations to finish, so its own time to first token goes up. You also pay more per-iteration overhead and get less efficient prefill.
- Chunks too large: prefill finishes fast, but you are right back to the blocking you were trying to remove.
在 vLLM 中,你主要通过每次迭代的令牌预算(max_num_batched_tokens)并在开启分块预填充(chunked prefill)的情况下控制这一点。这个预算基本上就是你的块大小调节旋钮。这也正是 Sarathi-Serve 的作者针对每次部署进行剖析而非硬编码的东西;他们的实验采用了如 512 和 2048 这样的预算,并针对延迟目标进行调优,这是一个合理的起始测试范围。
分块预填充并不是解决预填充与解码冲突的唯一答案。有三种常见方法,值得了解分块预填充在其中所处的位置。预填充优先(prefill-first)只是暂停解码来运行整个预填充,这很简单,但会导致上面所示的完全相同的顿挫。分块预填充将其切分并交错执行,并且它已成为大多数现代引擎的默认选择,因为它无需额外硬件就能平滑延迟。而分离式部署则更进一步,在独立的 GPU 池上运行预填充和解码,使得这两个阶段完全不竞争,这主要在大规模场景下才会有回报。如果你在单节点上运行,分块预填充几乎总是正确的工具。
还有一件通常会被忽略的事情:分块预填充与 PagedAttention 会相互影响。分块改变了预填充的内存访问模式,也改变了缓存块随时间填充的方式。这两者几乎总是被分开解释,但在实际部署中它们会叠加影响。如果你在调整令牌预算时不考虑缓存行为,你只看到了问题的一半。
调度策略:塑造尾延迟的选择
分块预填充决定了工作如何被切分。调度策略决定了谁的工作先运行。两者都会影响尾延迟,而后者通常保持默认设置。
以下是常见策略及其权衡:
- FCFS(先到先服务): vLLM 的默认策略。简单且公平,但一批长提示同时到达时,仍然会把所有人的尾延迟推高,因为没有任何机制表明“这次解码比那次预填充更紧急”。
- 基于优先级: 你给请求打上标签,让某些请求插队。当你有付费层级或需要保持快速的交互流量时很方便,但如果不小心,可能会饿死低优先级的任务。
- SLA 感知: 调度器尝试满足每个请求的延迟目标,而不是仅仅排序。运行成本更高,但它是唯一直接针对你真正关心的指标的方法。
调度的另一半是抢占,而这正是尾延迟的真正来源。当内存变得紧张时,服务器必须踢出一个序列才能继续运行。vLLM 有两种方式将其恢复:稍后从头重新计算其预填充,或者将其 KV 缓存换出到 CPU 内存再换回。两者代价都很高。关键是这些情况很少发生。而罕见且昂贵的事件恰恰决定了你的 p99。你的中位数请求永远不会被抢占。承受巨大惩罚的是位于尾部的那个请求。所以如果你想控制 p99,你就得控制谁被抢占以及被抢占的频率。这是一个调度决策。
以下是这些策略对比的大致指南:
| 调度策略 | 吞吐量 | p50 延迟 | p99 延迟 | 最适合 |
|---|---|---|---|---|
| FCFS(默认) | 高 | 良好 | 突发时较差 | 稳定、均匀的流量 |
| 基于优先级 | 高 | 对高优先级良好 | 对高优先级良好,对其他较差 | 混合层级,交互与批处理 |
| SLA 感知 | 略低 | 良好 | 最佳(如果目标设置得当) | 有真实延迟 SLA 的生产环境 |
| 激进抢占 / 大批量 | 最高 | 良好 | 最差 | 尾延迟无关紧要的离线批处理任务 |
真实流量所显示的情况
生产环境数据与基准测试结果不同的一个常见原因是,基准测试比真实工作负载干净得多。这不仅仅是直觉。当研究人员在ServeGen中描述真实 LLM 服务流量时,他们发现请求到达通常是突发的,变异系数高于 1,也就是说,固定速率或简单的泊松生成器无法很好地描述它们。BurstGPT 数据集在大规模上说明了同样的问题:它收集了来自 Azure 的 OpenAI 服务超过 213 天的 1000 多万条真实请求轨迹,并发现同时运行的请求数量会出现突然的突发性增长。合成测试通常以固定速率从单个客户端发送请求,且提示长度统一。真实流量有三个打破这种测试的习惯:
- 突发到达: 请求会聚集。同一秒内到达十个,然后三秒钟没有任何请求。突发时预填充会堆积并阻塞解码。
- 混合提示长度: 一条 50 个令牌的聊天消息和一份 30,000 个令牌的文档摘要命中同一台服务器。长提示正是导致短提示停滞的原因。
- 多租户负载: 许多用户共享 GPU,因此一个人的巨大提示就变成了另一个人的延迟尖峰。
如果你希望你的数据有意义,就要针对能捕捉这些特征的轨迹进行测试,而不是针对均匀负载。像 BurstGPT 和 Azure LLM 推理轨迹这样的公共数据集为你提供了真实的到达模式以及真实的提示词和响应长度分布。值得运行的测试很简单。取一个固定配置,在均匀负载下运行,然后回放同配置下的真实突发轨迹。报告两者。已有的研究已经告诉你会看到什么:p50 几乎不动,而 p99 大幅攀升,因为尾延迟是由突发和长提示决定的,而不是由平均请求决定。这个差距才是你应该关注的。这也是几乎没有供应商基准会展示给你的部分,这正是公开它能够赢得信任的原因。
如何判断你实际受限于什么
在改动任何配置之前,先弄清楚你属于这三个问题中的哪一个。看看你自己的流量。
你是否受限于预填充? 如果你的提示词与输出相比更长(RAG、文档处理、长系统提示词),并且主要抱怨是首令牌时间(time to first token),那么分块预填充是你这里最大的杠杆。
Are you decode-bound? Your outputs are long compared to your inputs (agents, long generations), and inter-token latency or throughput is the issue. Focus on batch size and memory headroom more than chunking.
Are you scheduling-bound? Your averages look fine but your tail gets worse under bursts. This is a policy and preemption problem.
Once you know which one you are, here are the first knobs to reach for, in order:
- Turn on chunked prefill if you have long prompts and a tail problem. Start with the default token budget.
- Tune
max_num_batched_tokens(your chunk size dial). If decodes still stall, lower it. If prefills feel too slow and decodes are fine, raise it. Move it in steps and measure against your trace, not against a single request. - Set
max_num_seqsto match the memory you actually have, so you preempt less often. - Pick a scheduling policy that fits your traffic. Leave FCFS on only if your load is truly uniform. Otherwise move to priority or SLA-aware.
A rough sense of when chunked prefill starts to matter: if your prompts are short (a few hundred tokens) and concurrency is low, it mostly adds overhead and you can skip it. As your prompts climb into the thousands of tokens, or concurrency rises to where prefills and decodes keep colliding, chunked prefill stops being optional and becomes the main thing keeping your tail flat. Do not chase magic numbers from a blog post, including this one. Measure your own traffic and let the numbers decide.
Common questions
What causes p99 latency spikes in vLLM? Long prefills blocking decodes that are already running. When a big prompt starts processing, everyone else’s token generation waits for that iteration to finish. It is a scheduling problem, not a raw compute limit, and it shows up under the bursty, mixed traffic that synthetic benchmarks usually miss.
Is chunked prefill the same as continuous batching? No. Continuous batching schedules per iteration, so finished sequences leave and new ones join after each step. Chunked prefill goes further by splitting a long prefill into smaller pieces so it can run next to decodes instead of blocking them. You use both together.
Does PagedAttention reduce latency or just memory usage? Directly, it manages KV cache memory and cuts fragmentation. It does not schedule anything, so it does not fix latency on its own. It helps indirectly, because once memory is no longer the hard limit on batch size, the scheduler has more room to interleave prefill and decode well.
How do I choose a chunk size? Treat the per-iteration token budget (max_num_batched_tokens) as your dial. Too small keeps decodes snappy but slows prefill and adds overhead. Too large brings back the blocking you were trying to fix. Start with the default, then adjust in steps while testing against a realistic traffic trace.
Why do my benchmarks look fine but production does not? Your benchmark probably used evenly spaced, same-size requests. Production traffic is bursty, mixes short and long prompts, and shares the GPU across users. Re-run your benchmark against a real trace like the Azure LLM Inference Trace or BurstGPT and watch what happens to p99.
When should I not bother with chunked prefill? When your prompts are short and concurrency is low. In that case it mostly adds overhead. It earns its keep as prompts grow into the thousands of tokens and concurrency rises to where prefills and decodes keep colliding.
Conclusion
Tail latency is not a hardware problem you can buy your way out of. It is a scheduling problem. A long prefill blocks the decodes already in flight, preemption fires at the worst moment, and a benchmark built on uniform load hides all of it. Chunked prefill is the main lever for the first problem, a policy that fits your traffic handles the second, and testing against bursty traces is how you stop being surprised in production. Start by working out whether you are prefill-bound, decode-bound, or scheduling-bound, then change one knob at a time and measure the tail, not the median.
None of this needs fancy infrastructure. Chunked prefill, paged memory, and preemption are already built into vLLM and the other major engines, so most of the work is understanding what they do and tuning them to your traffic, not building anything from scratch. The teams that get predictable p99s are usually not the ones with the biggest GPUs. They are the ones who know which bound they are hitting, who test against traffic that looks like production instead of a clean loop, and who are honest about the tradeoffs when they share their numbers. And if a single node is no longer enough, the same ideas keep going: disaggregating prefill and decode onto separate pools is the next step up, and it builds on exactly the scheduling intuition covered here.
If you take one thing away, let it be this. The median is comfortable, but the tail is where your users actually live. Measure the tail, tune for it, and the rest of the stack gets much easier to reason about.
——
zhirenhun
一个热爱技术的程序员,喜欢分享前沿AI知识和开发经验。